Reporting
Classes for handling reporting - adding customizable pieces of information to an HTML experiement run report.
This is handled through a base Reportable class, and each reporter class
extends it.
Classes:
|
Adds an HTML table to the report for the given pandas dataframe. |
|
Adds a passed matplotlib figure to the report. |
|
Adds the raw string of HTML passed to it to the report. |
|
Adds an indented JSON dump in a |
|
Takes set(s) of data, creates matplotlib line plots for it, and adds to the report. |
|
The base reporter class, any custom reporter should extend this. |
Functions:
|
Create a graphviz dot graph for the entire experiment. |
|
Create a graphviz dot graph of the stages/artifacts for the given record. |
|
Set up any necessary folders for a report at the given location. |
|
Attempts to return the unicode text for the graph svg. |
|
Get the HTML for displaying all reportables output. |
|
Dump out the JSON for all args used by manager. |
|
Generate and write out a more detailed graphviz graph for each record and return the html. |
|
Generates the report head tag. |
|
Generate the header and block of metadata at the top of the report. |
|
Render the table of contents for the reportables. |
|
Generate and write out the graphviz graph for the stages and return the html to display it. |
Render table of contents for the overall report. |
|
|
Render a reportable to file and get the HTML to display it. |
|
Generate a full HTML report for the given manager and passed argsets. |
|
Generate a nice index.html with a summary line for each experiment run report in the passed directory. |
-
class
curifactory.reporting.DFReporter(df: pandas.core.frame.DataFrame, name: Optional[str] = None, group: Optional[str] = None, float_prec: int = 4) Adds an HTML table to the report for the given pandas dataframe.
- Parameters
df (pd.DataFrame) – The pandas dataframe to include in the report.
float_prec (int) – the floating point precision to round all values to.
Note
If you need to use any of the pandas stylers, apply them and pass
df.render()to anHTMLReporterinstead.Methods:
html()When a report is created, the
html()function for every reportable is called and appended to the report.-
html() → list When a report is created, the
html()function for every reportable is called and appended to the report. This function should either return a single string of html, or can return a list of lines of html.Note
Any subclass is required to implement this.
-
class
curifactory.reporting.FigureReporter(fig, name: Optional[str] = None, group: Optional[str] = None, **kwargs) Adds a passed matplotlib figure to the report.
- Parameters
fig – A matplotlib figure to render.
kwargs – All keywords args are passed to the figures
savefig()call in render.
Methods:
html()When a report is created, the
html()function for every reportable is called and appended to the report.render()Any file outputs or calculations that should only run once go here.
Attributes:
All keywords args are passed to the figures
savefig()call in render.-
html() → str When a report is created, the
html()function for every reportable is called and appended to the report. This function should either return a single string of html, or can return a list of lines of html.Note
Any subclass is required to implement this.
-
kwargs All keywords args are passed to the figures
savefig()call in render.
-
render() Any file outputs or calculations that should only run once go here.
-
class
curifactory.reporting.HTMLReporter(html_string: Union[str, list], name: Optional[str] = None, group: Optional[str] = None) Adds the raw string of HTML passed to it to the report.
- Parameters
html_string (str) – The raw string of HTML to include.
Example
@stage(...)
def report_hello(record: Record ,...):
    record.report(HTMLReporter("<h1>Hello world!</h1>"))
Methods:
html()When a report is created, the
html()function for every reportable is called and appended to the report.Attributes:
The raw string of HTML to include.
-
html() → Union[str, list] When a report is created, the
html()function for every reportable is called and appended to the report. This function should either return a single string of html, or can return a list of lines of html.Note
Any subclass is required to implement this.
-
html_string The raw string of HTML to include.
-
class
curifactory.reporting.JsonReporter(dictionary, name: Optional[str] = None, group: Optional[str] = None) Adds an indented JSON dump in a
<pre>tag for a passed dictionary.- Parameters
dictionary (Dict) – The python dictionary to write to a JSON string. Technically this can be anything json-serializable, so this includes single values and lists.
Methods:
html()When a report is created, the
html()function for every reportable is called and appended to the report.-
html() → list When a report is created, the
html()function for every reportable is called and appended to the report. This function should either return a single string of html, or can return a list of lines of html.Note
Any subclass is required to implement this.
-
class
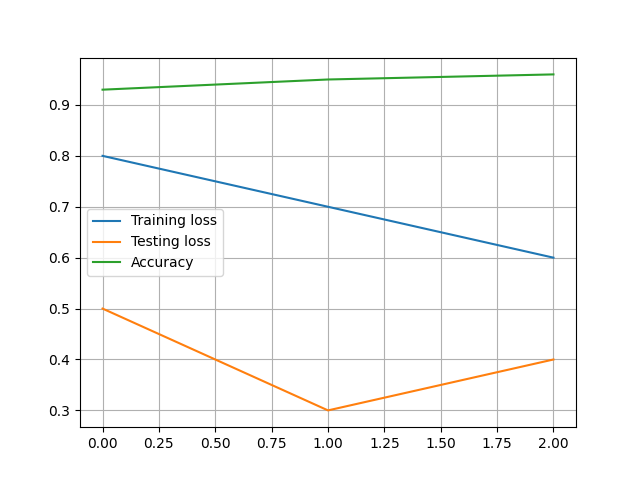
curifactory.reporting.LinePlotReporter(y, x=None, name: Optional[str] = None, group: Optional[str] = None, plot_kwargs: dict = {}, savefig_kwargs: dict = {}) Takes set(s) of data, creates matplotlib line plots for it, and adds to the report.
There are several ways to use this reportable, x (optional) and y are both either a single list/numpy array of data, or are both dictionaries of lists/numpy arrays of data to plot.
Possible combinations:
Passing a single list/numpy array of only y data
Passing a single list/numpy array of y and x data
Passing a dictionary (where keys appear in the legend) of lists/numpy arrays of y data, each to be plotted as its own line.
Passing a dictionary (where keys appear in the legend) of lists/numpy arrays of both y and x data, each to be plotted as its own line.
- Parameters
y – a single list/numpy array or dictionary of lists/numpy arrays of y data.
x – (optional), a single list/numpy array or dictionary of lists/numpy arrays of x data. If specified, this must match y.
plot_kwargs (Dict) – The **kwargs to pass to the matplotlib
plt.plot()call.savefig_kwargs (Dict) – The **kwargs to pass to the
fig.savefig()call on render.
Example
@stage(...)
def report_results(record: Record, ...):

    train_loss = [0.8, 0.7, 0.6]
    test_loss = [0.5, 0.3, 0.4]
    acc = [.93, 0.95, 0.96]

    record.report(LinePlotReporter(
        y={
            "Training loss": train_loss,
            "Testing loss": test_loss,
            "Accuracy": acc
        },
        name="training_history"))
The above block will result in the following graph added to the report:
Methods:
html()When a report is created, the
html()function for every reportable is called and appended to the report.render()Any file outputs or calculations that should only run once go here.
-
html() → str When a report is created, the
html()function for every reportable is called and appended to the report. This function should either return a single string of html, or can return a list of lines of html.Note
Any subclass is required to implement this.
-
render() Any file outputs or calculations that should only run once go here.
-
class
curifactory.reporting.Reportable(name=None, group=None) The base reporter class, any custom reporter should extend this.
- Parameters
name (str) – A (optional) reference name to give this piece of reported info, it is used as the title string suffix. If
Noneis supplied, it will be suffixed with the number of the reportable.group (str) – An optional string to use for grouping multiple related reportables together in the report. By default, all reportables are ordered by record. This will create a separate entry on the TOC and put them next to each other in the report.
Note
When subclassing a reportable,
html()must be overriden, andrender()optionally may be depending on the nature of the reportable. If a reportable relies on some form of external file, such as an image or figure, implementrender()to save it (using this class’spathvariable as the directory), and then reference it in the output fromhtml(). The internal reporting mechanisms handle calling both of these functions as needed.A simplified example of the
FigureReporteris shown here:class FigureReporter(Reportable): def __init__(self, fig, name=None, group=None): self.fig = fig super().__init__(name=name, group=group) def render(self): self.fig.savefig(os.path.join(self.path, f"{self.qualified_name}.png")) def html(self): return f"<img src='{self.path}/{self.qualified_name}.png'>"
Attributes:
If specified, reports group all reportables with the same
groupvalue together.if a custom reportable is saving anything in a render function, don’t use just name in the path.
Set internally by reporting functions, this variable holds a valid path where a reportable can save files (e.g.
The full prefixed name including the stage name and aggregate indicator.
The record this reportable came from, automatically populated via
record.report()A flag indicating whether this reportable’s
render()has been called yet or not.The name of the stage this reportable comes from, used as part of the title.
Methods:
html()When a report is created, the
html()function for every reportable is called and appended to the report.render()Any file outputs or calculations that should only run once go here.
-
group: str If specified, reports group all reportables with the same
groupvalue together.
-
html() → Union[str, list] When a report is created, the
html()function for every reportable is called and appended to the report. This function should either return a single string of html, or can return a list of lines of html.Note
Any subclass is required to implement this.
-
name: str if a custom reportable is saving anything in a render function, don’t use just name in the path.
self.qualified_nameshould be preferred, as it is the fully prefixed name.- Type
The suffix to title the reportable with. NOTE
-
path: str Set internally by reporting functions, this variable holds a valid path where a reportable can save files (e.g. images) as needed. This is available to access both in
render()andhtml()
-
qualified_name: str The full prefixed name including the stage name and aggregate indicator. This is set by the record when a
report()is called.
-
record The record this reportable came from, automatically populated via
record.report()- Type
-
render() Any file outputs or calculations that should only run once go here.
-
rendered: bool A flag indicating whether this reportable’s
render()has been called yet or not.
-
stage: str The name of the stage this reportable comes from, used as part of the title.
-
curifactory.reporting.map_full_svg(manager, detailed: bool = False, colors: Optional[Union[list, dict]] = None) → graphviz.graphs.Digraph Create a graphviz dot graph for the entire experiment. (Maps out each stage and the input/output artifacts for each.)
- Parameters
manager (ArtifactManager) – the manager to base the graph off of.
detailed (bool) – Whether to include artifact preview and caching information or not.
colors – A list or dictionary of colors to use if you wish to override the default.
Important
For this function to run successfully, graphviz must be installed.
-
curifactory.reporting.map_single_svg(manager, record, detailed: bool = True, colors: Optional[Union[list, dict]] = None) → graphviz.graphs.Digraph Create a graphviz dot graph of the stages/artifacts for the given record.
- Parameters
manager (ArtifactManager) – the manager to base the graph off of.
record (Record) – The specific record to make the graph for.
detailed (bool) – Whether to include artifact preview and caching information or not.
colors – A list or dictionary of colors to use if you wish to override the default.
Important
For this function to run successfully, graphviz must be installed.
-
curifactory.reporting.prepare_report_path(output_path: str, report_name: str) → tuple Set up any necessary folders for a report at the given location. This will not error if the location already has a report in it, but will remove existing reportables and graphs.
- Returns
A tuple containing the folder path to place the report html, the subdirectory within that folder to place the graphviz files, and the subdirectory to place any rendered reportable files.
-
curifactory.reporting.render_graph(graph) Attempts to return the unicode text for the graph svg.
-
curifactory.reporting.render_report_all_reportables(manager, reportables_path: str, override_display_path: Optional[str] = None, notebook: bool = False) → list Get the HTML for displaying all reportables output.
-
curifactory.reporting.render_report_argset_dump(manager) → list Dump out the JSON for all args used by manager.
-
curifactory.reporting.render_report_detailed_stage_maps(manager, graphs_path) → list Generate and write out a more detailed graphviz graph for each record and return the html.
-
curifactory.reporting.render_report_head(manager) → list Generates the report head tag.
-
curifactory.reporting.render_report_info_block(manager) → list Generate the header and block of metadata at the top of the report.
-
curifactory.reporting.render_report_reportables_toc(manager) → list Render the table of contents for the reportables.
-
curifactory.reporting.render_report_stage_map(manager, graphs_path) → list Generate and write out the graphviz graph for the stages and return the html to display it.
-
curifactory.reporting.render_report_toc() → list Render table of contents for the overall report.
-
curifactory.reporting.render_reportable(reportable: curifactory.reporting.Reportable, manager, reportables_path: str, override_display_path: Optional[str] = None, notebook: bool = False) → list Render a reportable to file and get the HTML to display it.
-
curifactory.reporting.run_report(manager, output_path: str, name: str, css_path: Optional[str] = None) → tuple Generate a full HTML report for the given manager and passed argsets.
- Parameters
manager (ArtifactManager) – The manager to base the graph off of.
output_path (str) – The string path to the root directory of where you want the report stored.
name (str) – The name to store this report under (will generate a folder of this name in the output_path.
css_path (str) – The path to a css file to use for styling the report. (This file will get copied into the output_path/name folder.)
- Returns
A tuple containing the folder path to place the report html, the subdirectory within that folder to place the graphviz files, and the subdirectory to place any rendered reportable files.
-
curifactory.reporting.update_report_index(experiments_path: str, reports_root_dir: str) Generate a nice index.html with a summary line for each experiment run report in the passed directory.
- Parameters
experiments_path (str) – The path to where the experiment scripts are, used to get any top experiment description comments from the file.
reports_root_dir (str) – The directory containing the report folders. This is where the output index.html is placed.