Reports
Every experiment that runs to completion generates an HTML run report stored in a run-specific folder in
the reports/ directory, and adds a listing with a link to it in the main reports index.html.
Report structure
Reports have 5 sections:
Experiment metadata - this includes information about the run, such as timestamp, current git commit hash, and the list of hashes of the parameter sets that were used. Additionally, the CLI command that was used to run the experiment is included, as well as the command necessary to directly reproduce it if run with
--full-store.Reportables - any reportables added in any of the stages are rendered here, along with a ToC for them. By default they are ordered by the record they came from, but this can be changed with Reportable groups.
Map - assuming graphviz is installed, an svg “graph” or rough DAG of the experiment is displayed, with ovals representing each stage, and the boxes representing the outputs from that stage. This maps the flow of data from one stage to another. Each colored box corresponds to a record, and the name of the parameter set used in that record is displayed at the top.
Stage Detail - this renders an svg graph with graphviz similar to the map, but each record is displayed separately, and shows additional details for each piece of data represented. It attempts to preview the content of the data, and will try to show the length or shape of it, as relevant. If the data is cached, it will show the full path to the cached file.
Parameter sets - the final section is a full JSON dump of all parameter sets used in the run.
Examples of these sections are displayed below:
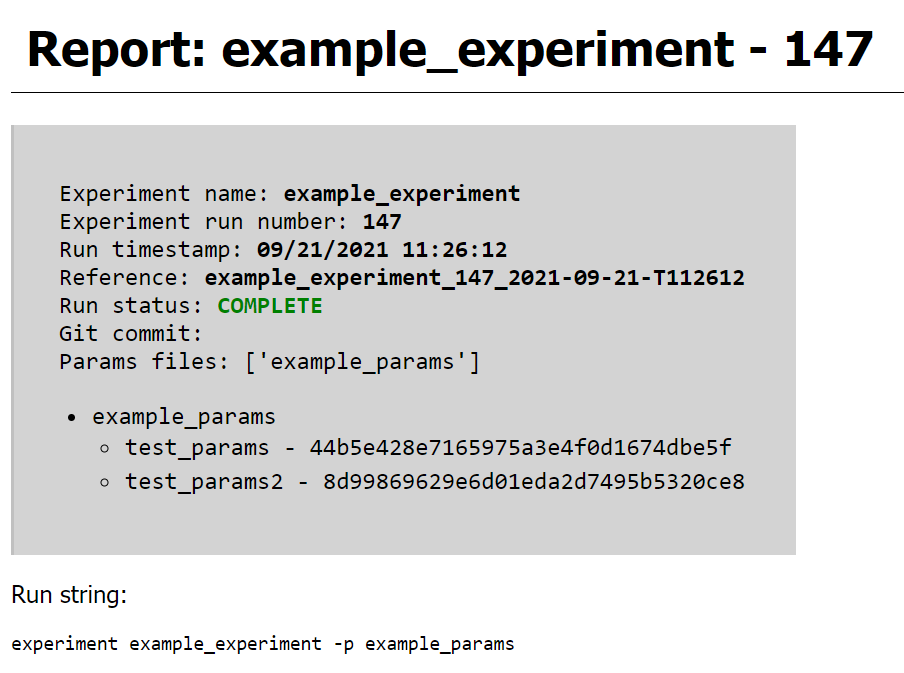
An experiment metadata section. The hashes are the hash strings that are used to prefix cached data from records using that parameter set.
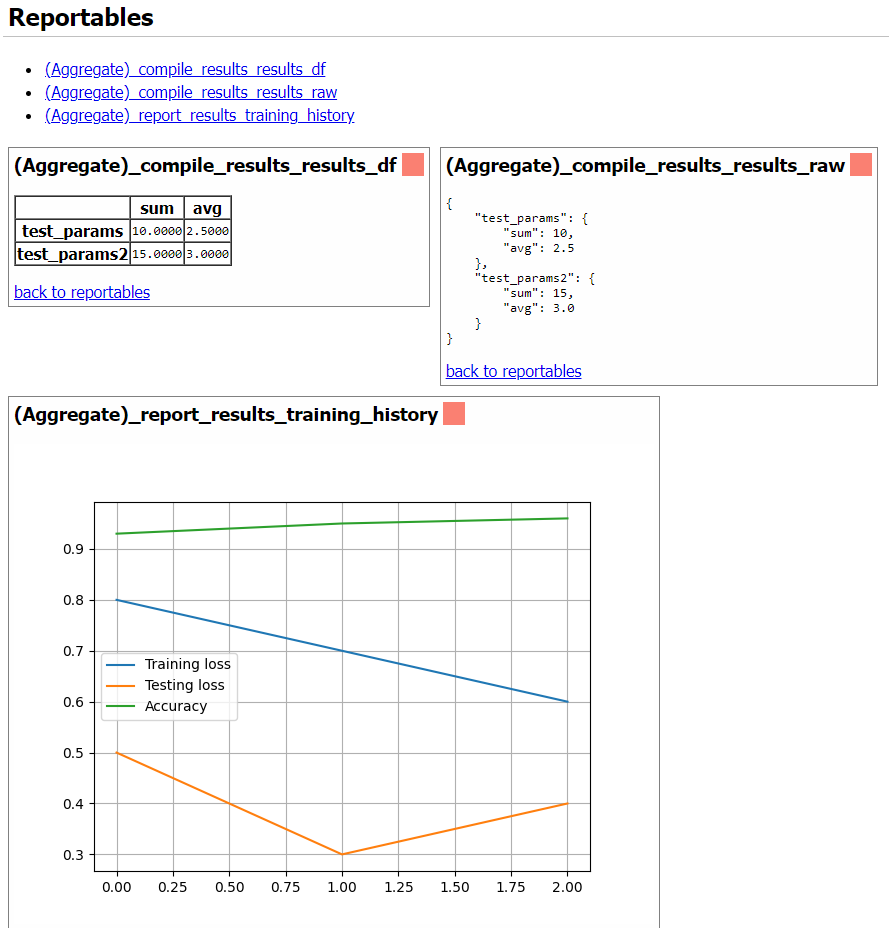
A reportables section, in this case most reportables came from an aggregate stage named “compile_results”, and one from “report_results”, reflected in the title for each reportable. The small colored box to the right of each reportable corresponds to the color of the record it came from as shown in the maps below.
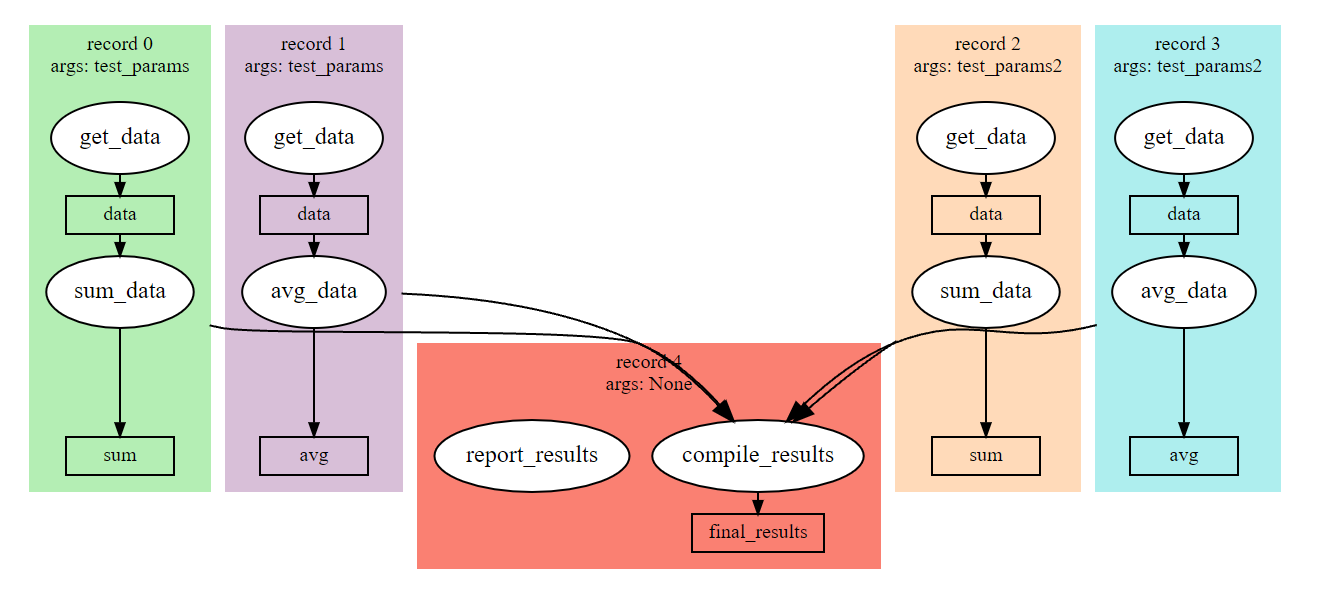
An example experiment map. The compile_results stage is an aggregate stage in this
case, and you can visually identify which records are passed into it.
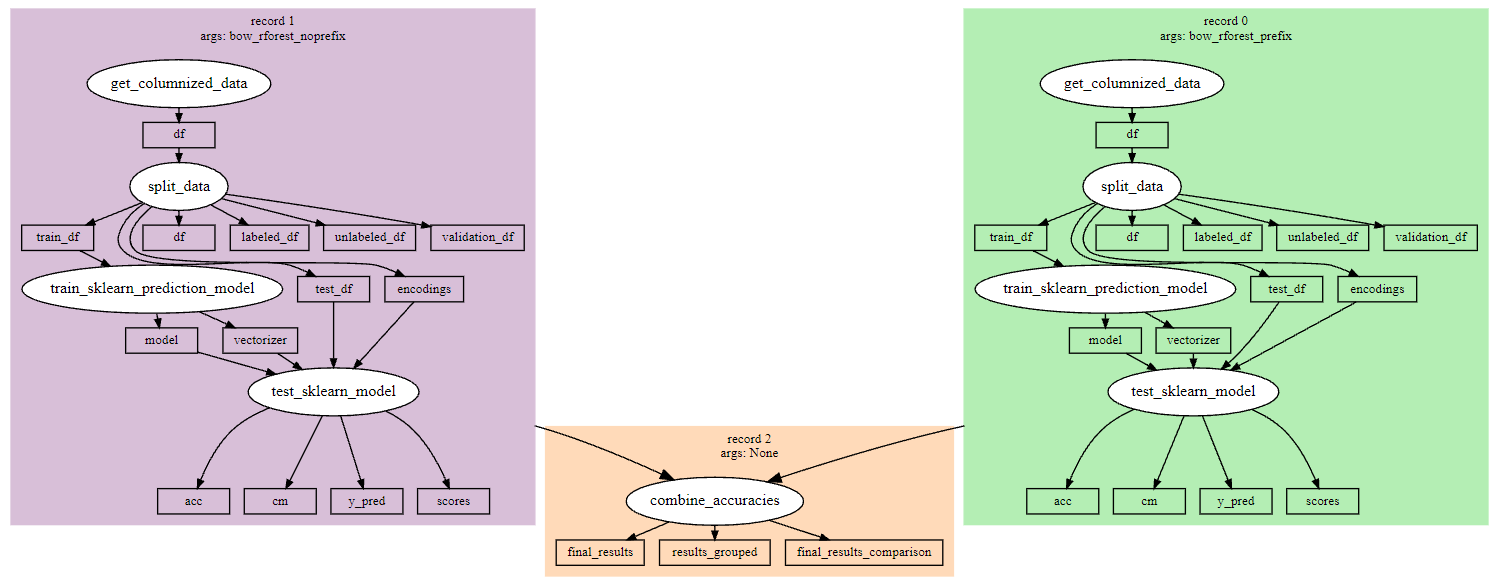
A more complicated experiment map. This can be a useful tool to help determine where specific variables in a record state are coming from and where they’re used.
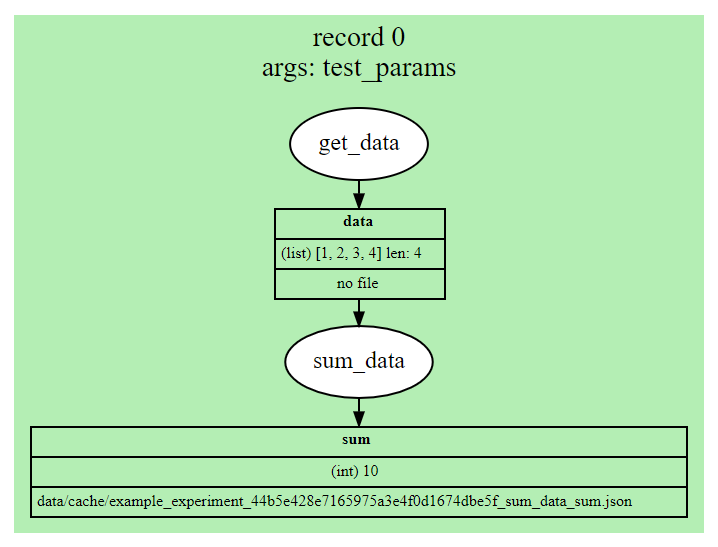
An example of a record in the stage detail section. In order, the details for each piece of data show 1) the name, 2) the data type and preview (and length or shape if possible), and 3) the path to the cache file if it was cached.
Reportables
Reportables are renderable things you can create inside of stages that show up in the report, making it easier to get information and results output for analysis without having to dig through cached data to visualize it. This can include things like tables, plots, etc.
The design for reportables is similar to cacheables in that there are several
pre-defined types of reportables as part of Curifactory, and you can define custom ones
by extending the base Reportable class.
The pre-defined reportable classes are:
DFReporter- Renders an HTML table for a given pandas dataframe.FigureReporter- Renders a given matplotlib figure.HTMLReporter- Directly renders given HTML.JsonReporter- Renders an indented JSON dump of a dictionary.LinePlotReporter- Creates and renders a matplotlib figure for passed data.
Check the Reporting API documentation for each of these for more information on individual usage.
Reportables are added to the report by calling record.report(REPORTABLE_CLASS(...)) and optionally
providing a name and group string. (A reportable with no name is simply assigned a 0-based index number.)
When defining a custom reportable, you must extend the reporting.Reportable
class and override the html() function, which should return the HTML snippet to be included in the
report. Depending on the nature of the reportable, you may also wish to override the
render() function as well. If a reportable relies on some form of external file,
such as an image or figure, implement render() to save it (using this class’s
path variable as the directory), and then reference it in the output from
html(). The internal reporting mechanisms handle calling both of these functions
as needed.
A simplified example of the FigureReporter is shown here:
class FigureReporter(Reportable):
    def __init__(self, fig, name=None, group=None):
        self.fig = fig
        super().__init__(name=name, group=group)

    def render(self):
        self.fig.savefig( f"{self.path}{self.name}.png")

    def html(self):
        return f"<img src='{self.path}{self.name}.png'>"
Reportable groups
By default, the reportables are rendered to the report grouped by record and in the order
in which they are added. However, if there are a lot of things reported in each record, it can
sometimes be difficult to compare specific reportables across the records. This can be
addressed by specifying the group string parameter in the reportable constructors. All
reportables with the same group value are rendered next to eachother in the output report.