Quick Start
Use the calibrated IN625 single-track AMB2018-02-B tutorial as the first case.
Copy the tutorial
Copy the tutorial to a writable run directory:
mkdir -p "$FOAM_RUN/AdditiveFOAM"
cd "$FOAM_RUN/AdditiveFOAM"
cp -r "$ADDITIVEFOAM_TUTORIALS/AMB2018-02-B" first-track
cd first-track
Inspect the processor count in system/decomposeParDict and ensure the requested MPI ranks are available.
Run
./Allrun
The script runs blockMesh, decomposes the case, runs additiveFoam in parallel, reconstructs the OpenFOAM fields, and conditionally reconstructs ExaCA and solidification data.
Follow progress in another terminal:
tail -f log.additiveFoam
The log reports the AdditiveFOAM build identity, time step, Courant/diffusion/thermo numbers, source depth, absorbed power, and thermodynamic iteration residual.
Visualize results
The Allrun script reconstructs the parallel solution into the case time directories. ParaView can read these OpenFOAM fields through an empty .foam marker file:
touch first-track.foam
paraview first-track.foam
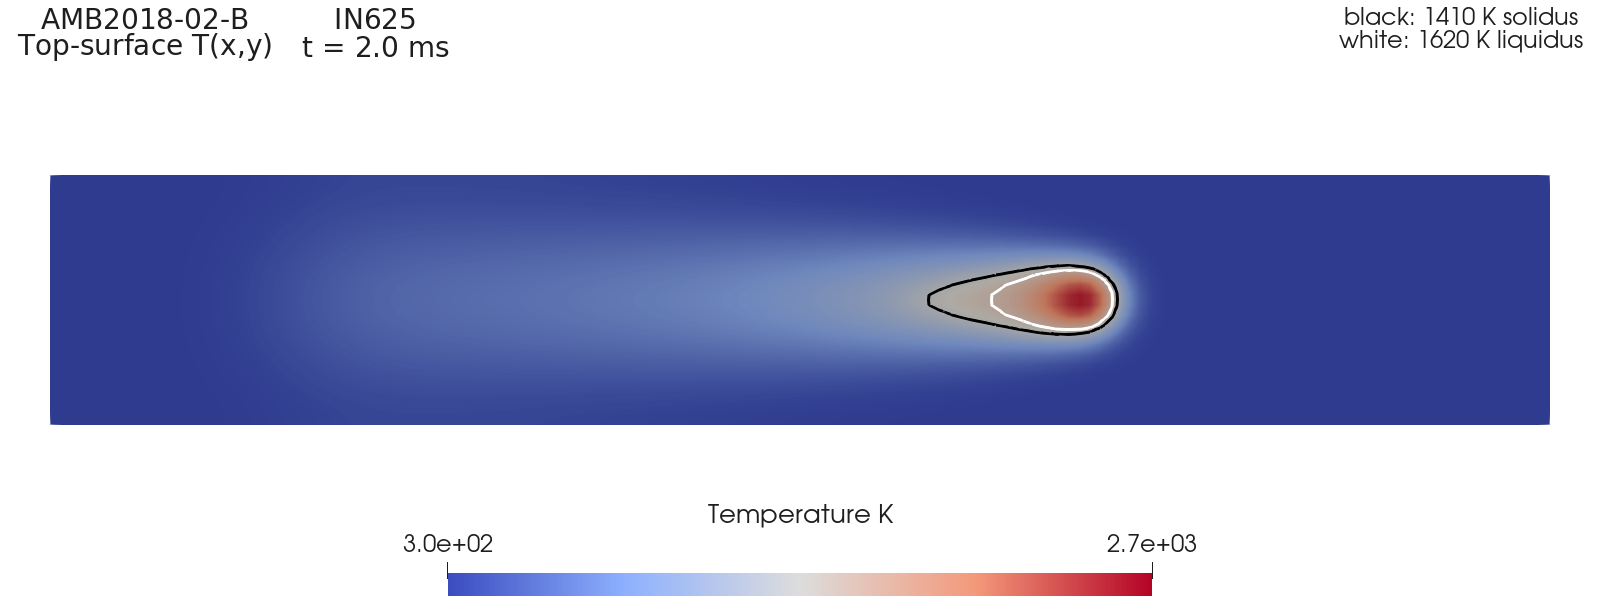
In ParaView, select first-track.foam in the Pipeline Browser and click Apply in the Properties panel. Use the time controls to move to the final time, then select a field from the Coloring menu. Start with T to view the temperature field. A Slice through the scan plane shows the thermal wake, while a Contour at the material solidus or liquidus shows the corresponding melt-pool boundary.
Select alpha.solid to distinguish solid, mushy, and liquid regions; alpha.powder to identify unconsolidated material; qDot to view the instantaneous volumetric source; and U to examine melt-pool flow when fluid coupling is enabled. The primary fields are:
| Field | Meaning |
|---|---|
T |
Temperature |
U |
Mixture velocity; initialized to zero if absent |
p_rgh |
Reduced pressure; initialized to zero if absent |
alpha.powder |
Powder volume fraction; initialized to zero if absent |
alpha.solid |
Solid fraction calculated from T and thermoPath |
qDot |
Total volumetric heat input from all beams |
Use plotPower separately from ParaView to plot the volume-integrated heat-source power recorded in log.additiveFoam:
plotPower
plotPower creates power.png in the case directory. The spatially integrated source should converge to the expected absorbed power: absorptivity multiplied by the prescribed source power.